How we built NiaAge: A biological age score that actually makes sense
.webp)
Most people have heard of “biological age.” Few can explain what biological age is or what it really measures. And even fewer can use it to make a real health decision. This is because there is no clear consensus as to what is a biological age, how it should be used, and most lack transparency as to how they were calculated.
It is this gap that led our team, COO Mike Goss, data scientist Jonah Kember, CTO Saif Mahmud and our clinical research team — to create NiaAge.
The Problem We Wanted to Solve
Here is an inside look at how we created NiaAge, and how results can be used to optimize your healthspan.
We started with a simple observation: while pre-existing biological age and health scores are a great way for people to understand how they are doing in different health areas, they often don't capture how healthy someone truly is for their age.
A 65-year-old with great habits and excellent biomarkers could appear “worse” than a 35-year-old, simply because of age. Meanwhile, a younger person with poor lifestyle habits might still score as “average.”
As Jonah put it, “We wanted to account for the fact that you can be older but relatively healthy for your age.”
NiaAge addresses this by taking age into account; comparing you to people your own age, not to a 25-year-old or an unrealistic population average.
Why Other Biological Age Scores Fall Short
Biological age isn’t a new idea, but most tools built around it leave people more confused than informed. Many claim to reveal how “old” your body is, yet few clearly explain what biological age actually measures or how their results should guide real-world health decisions. That’s why, before building NiaAge, we examined the most common approaches—and their limitations.
- DNA methylation and telomere tests focus on changes at the cell level. The science is promising, but results are inconsistent and hard to apply clinically.
- Mortality-based models, such as the Gompertz model, describe how the risk of dying or getting sick increases as people get older.
- Mathematical/machine based learning builds on Mortality-based models. These are often helpful in population studies, but not as helpful for someone trying to stay healthy and strong.
For NiaAge, we didn’t want a tool that only predicts population risk—or a death clock with no guidance. We wanted one that asks: Are you thriving for your age? And how can you thrive for your age?
Why NiaAge Gives More Personalized Insights
Inspired by these models, Mike, Jonah, Saif and our research team adapted the concept behind mortality based models to focus on healthspan — that is, how your body is performing today compared with others your age.
Using our own anonymized dataset and cross-checking it against large open datasets like NHANES, the teammapped how each key biomarker naturally changes with age.
For example:
- ApoB, a cholesterol-related marker, rises gradually and levels off around age 50.
- Fasting glucose and A1C creep upward with age but vary widely between individuals.
- Diastolic blood pressure peaks in midlife, then tends to decline later on.
By modeling age curves for every major biomarker — including blood pressure, inflammation markers, liver enzymes, and glucose — we could see who was doing better or worse than expected for their age and sex.
That model became NiaAge: A single, easy-to-read number showing how your biology compares to your peers. If your NiaAge is lower than your calendar age, your body is performing younger than your years.
If it’s higher, your biology may be showing more wear — and that’s valuable insight you can act on.
The Science Behind NiaAge
Building a biological age model we could stand behind took over two years of research, expert input, and countless model revisions. We drew on academic research and large public datasets; but our focus was on translating that science into tools that help people today.
We drew insights from multiple sources — including the LinAge model, the National Health and Nutrition Examination Survey (NHANES), and the Gompertz model — each offering a different lens on how biology and aging connect.
In longevity research, Gompertz age describes the age at which a person’s risk of dying matches that of the general population. It’s based on the Gompertz–Makeham law of mortality, which shows that the risk of death rises exponentially as we age.
Large studies like NHANES in the U.S. and the UK Biobank in the U.K. have used the Gompertz age principle to predict long-term mortality from common biomarkers such as cholesterol, glucose, blood pressure, and inflammation markers.
The LinAge model builds upon these concepts by bringing in machine learning to estimate risk. LinAge provides valuable insights, but when applied to the NiaHealth population, it showed clear limitations, overemphasizing risk factors that have a large short-term impact on outcomes and underestimating risk factors that have longer-term impacts (10+ year time horizon).
Ultimately, we found that the Gompertz and LinAge models are powerful for understanding short-term population-level risks that our current healthcare system focuses on, but fall short when predicting the healthspan of individual people over long timeframes (10+ years).
Interestingly, though, they make a great measuring stick — a way to check whether our own model stands up in the real world. (More on that below.)
Choosing the Right Biomarkers
Our next step was aligning on how to incorporate biomarkers in the NiaAge model, and how much weight each biomarker should have in determining the end result.
We evaluated all NiaHealth biomarkers according to the following criteria:
1. Do they change meaningfully with age?
and
2. Do they strongly influence overall health outcomes?
Markers that met these criteria, like diastolic blood pressure, ApoB, fasting glucose, A1C, and ferritin, made the cut.
The markers most tightly associated with health outcomes were weighted more strongly in the final NiaAge model.
Finally, in order to avoid over-indexing on certain health outcomes, when multiple highly correlated biomarkers were all related to a single aspect of health, we included only the marker with the strongest link to the health outcome. This ensures that NiaAge is interpretable and avoids the common issue in models purely focused on outcome, where the effect of key biomarkers is diluted simply because that effect is captured redundantly by many correlated markers.
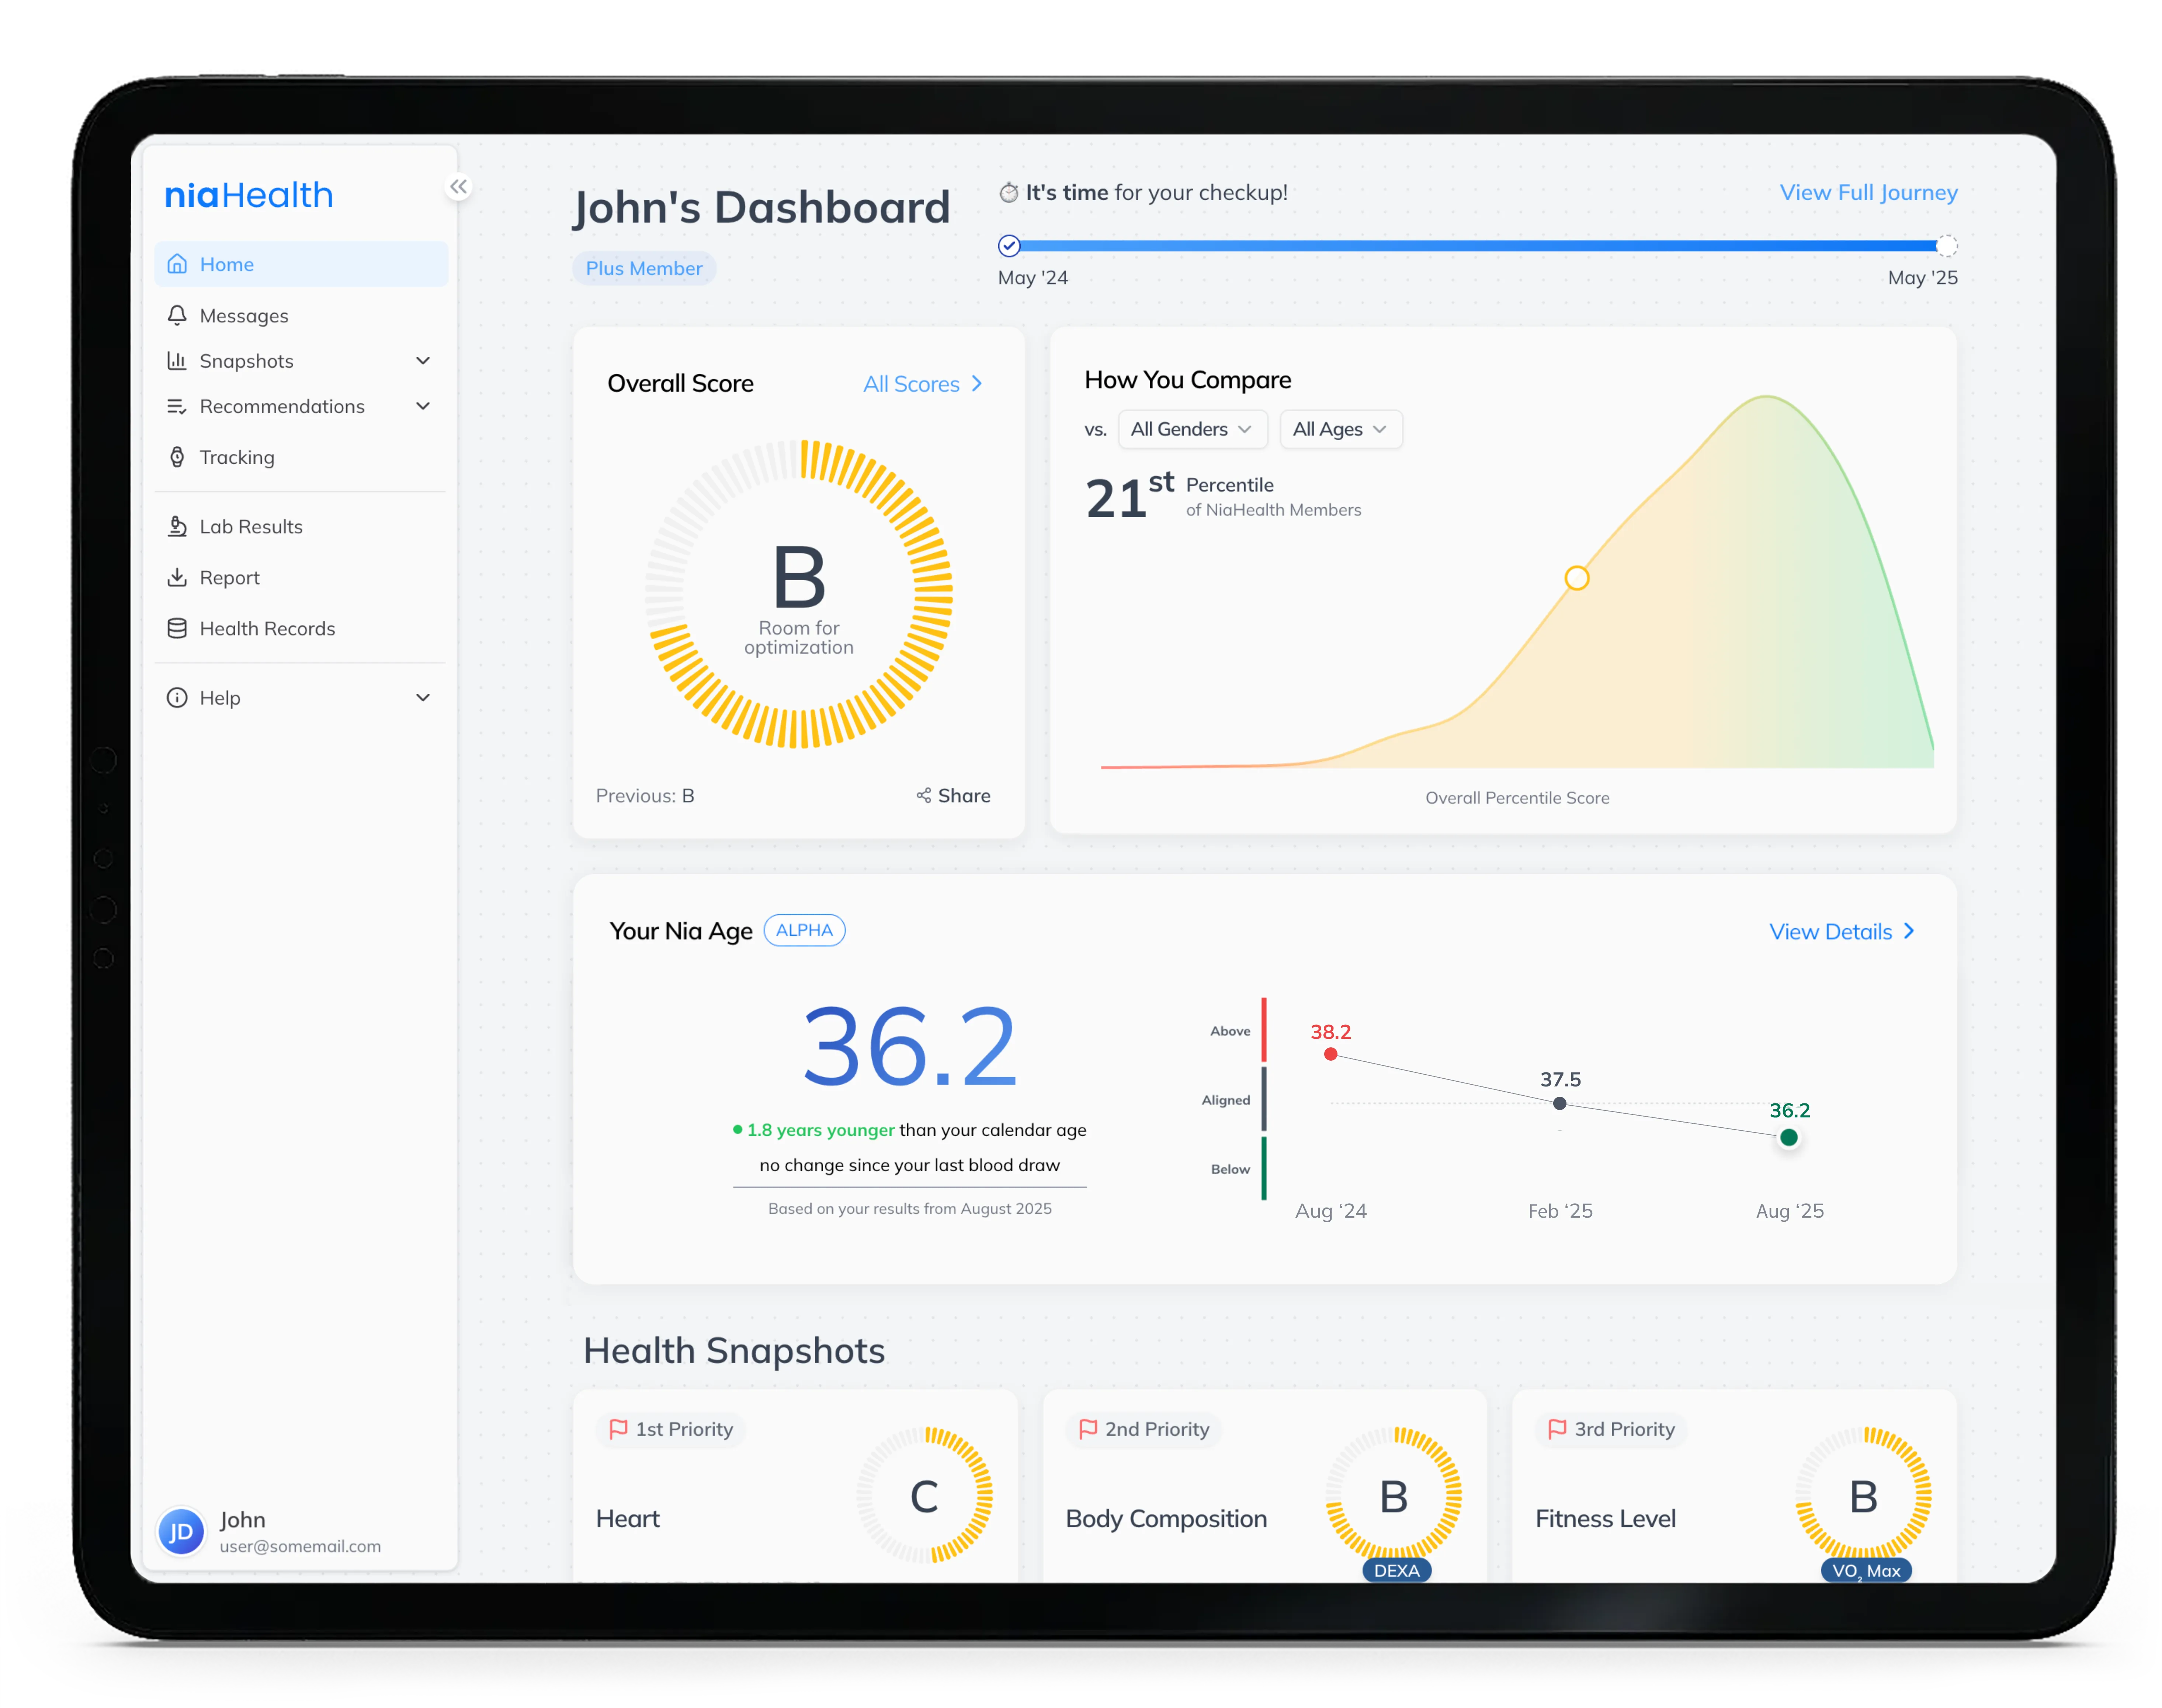
Putting NiaAge on the Dashboard
How NiaAge is presented to our members is very important to us. Consultation with our NP team - the people you see in your 1:1 consults, engaging our design team, and conducting member interviews have been key to making sure that we frame NiaAge correctly.
Framing matters because when someone sees that their NiaAge is five years older than their calendar age, what they really want to know is how to change it. That’s where the clinical conversation begins — not where it ends.
Each member has a personalized dashboard that highlights their top three “impact markers”:
- Green = markers that are contributing to a younger NiaAge
- Red = markers that are contributing to an older NiaAge
We designed it this way so the number always tells a story — where you’re hitting your health targets, and where your biggest opportunities lie. It’s not a death clock, or a countdown clock. It’s about how healthy you are for your age.
What Happens Next
We’re continuing to validate NiaAge with larger samples and refine how it links to lifestyle change. Early feedback has been energizing — clients find it motivating, not scary. They see that everyday choices can shift their biology, and that’s the whole point. NiaAge is currently in alpha, and available to select test users.
Our editorial standards & process
At NiaHealth, our mission is to make proactive health possible for all Canadians—by combining science with humanity. We believe that rigorous, evidence-informed health information should never feel out of reach. Every word we publish is intentional. We choose language that empowers rather than overwhelms, clarifies rather than complicates, and respects the lived experiences behind every health question. Learn more here.